Cole Monnahan writes:
I’ve got a multipanel plot and simply want to add “(a)”, “(b)”, etc. to it. I’ve always cheated and used legend:
add.label <- function(label, ...) legend("topleft", legend=" ", title=label,
bty='n', ...)
which works great for a topleft position. But for bottomright it isn’t right. I can adapt, and that works great, but then it doesn’t work for topleft!
There has got to be a non-hack way to do this simple (and common) task.
I’d never thought of using legend() for that purpose, but that’s a neat
hack. If you wanted to stick with legend(), you could just
pass the position to the function:
add_label_legend <- function(pos = "topleft", label, ...) {
  legend(pos, label, bty = "n", ...)
}

par(mfrow = c(1, 2), mar = c(2, 2.5, 0, 0))
for(i in 1:2) {
  plot(1)
  add_label_legend("topleft", paste0("(", letters[i], ")"))
  add_label_legend("topright", paste0("(", letters[i], ")"))
  add_label_legend("bottomright", paste0("(", letters[i],
      ")"))
  add_label_legend("bottomleft", paste0("(", letters[i], ")"))
}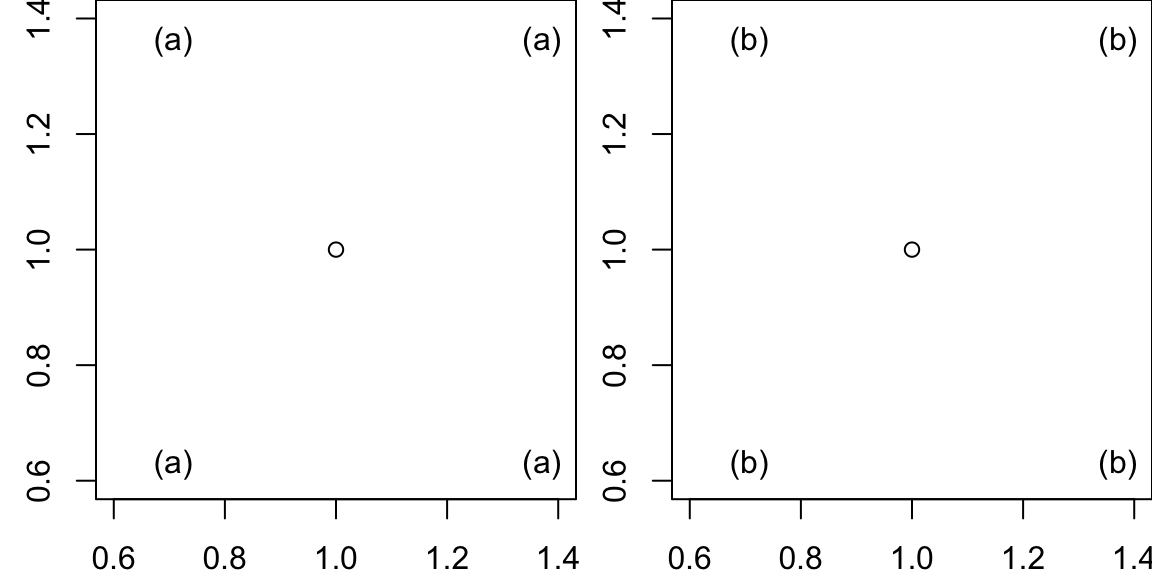
But, you don’t get a lot of control over precisely how the label is positioned.
I tend to use mtext() for quick cases where the labels are all the same
width. For example if they’re single letters, then you can align the labels
like this:
par(mfrow = c(1, 2), mar = c(2, 2.5, 0, 0))
for(i in 1:2) {
  plot(1)
  mtext(paste0("(", letters[i], ")"), side = 3, adj = 0.05,
    line = -1.3)
}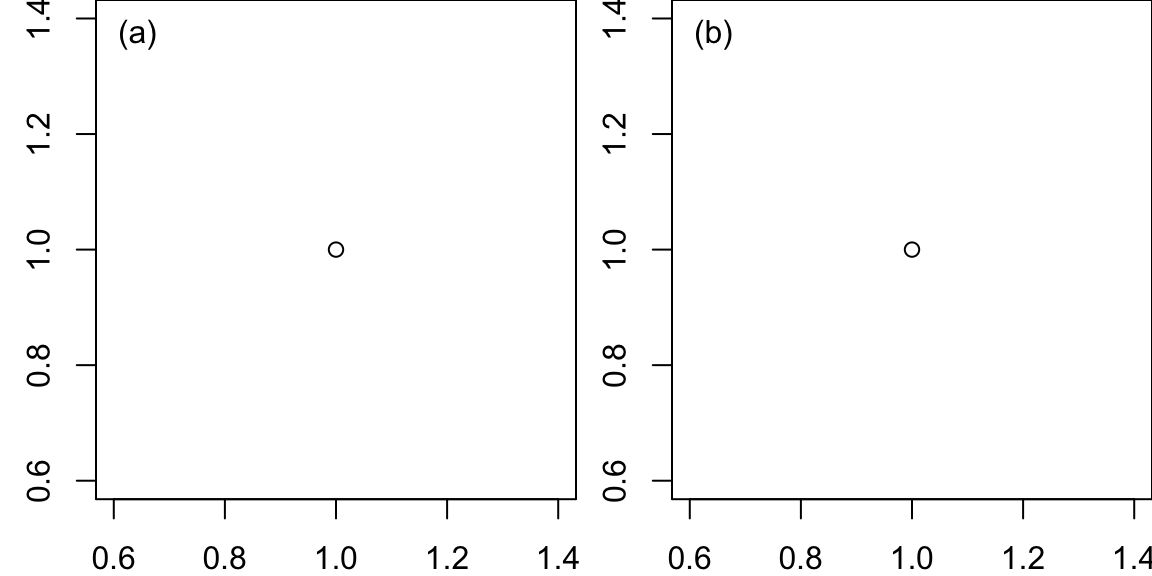
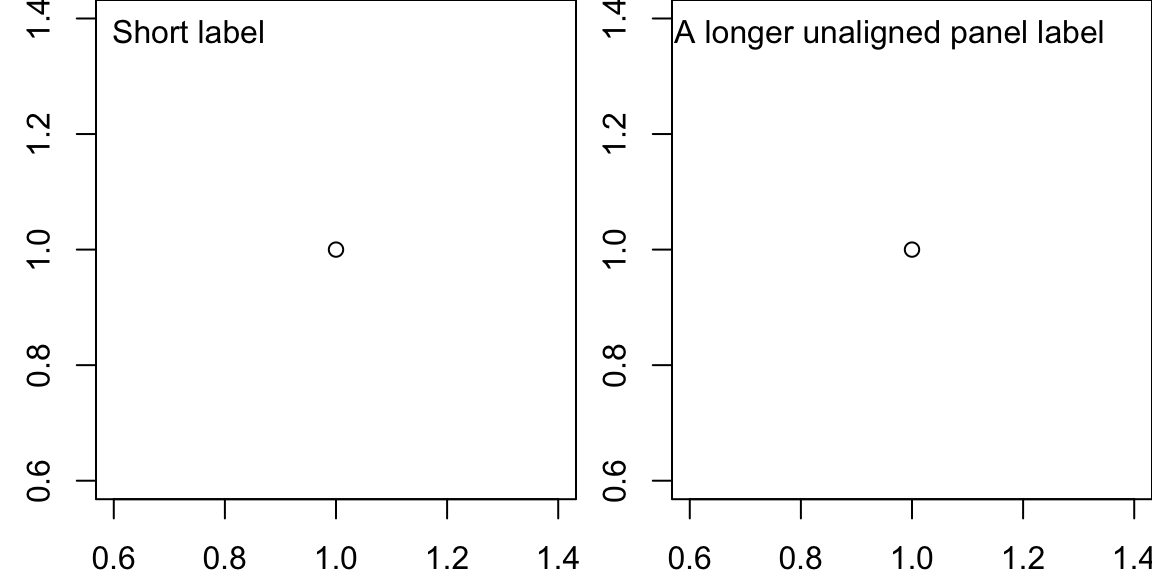
But the labels won’t align if they are different widths:
labels <- c("Short label", "A longer unaligned panel label")
par(mfrow = c(1, 2), mar = c(2, 2.5, 0, 0))
for(i in 1:2) {
  plot(1)
  mtext(labels[i], side = 3, adj = 0.05, line = -1.3)
}
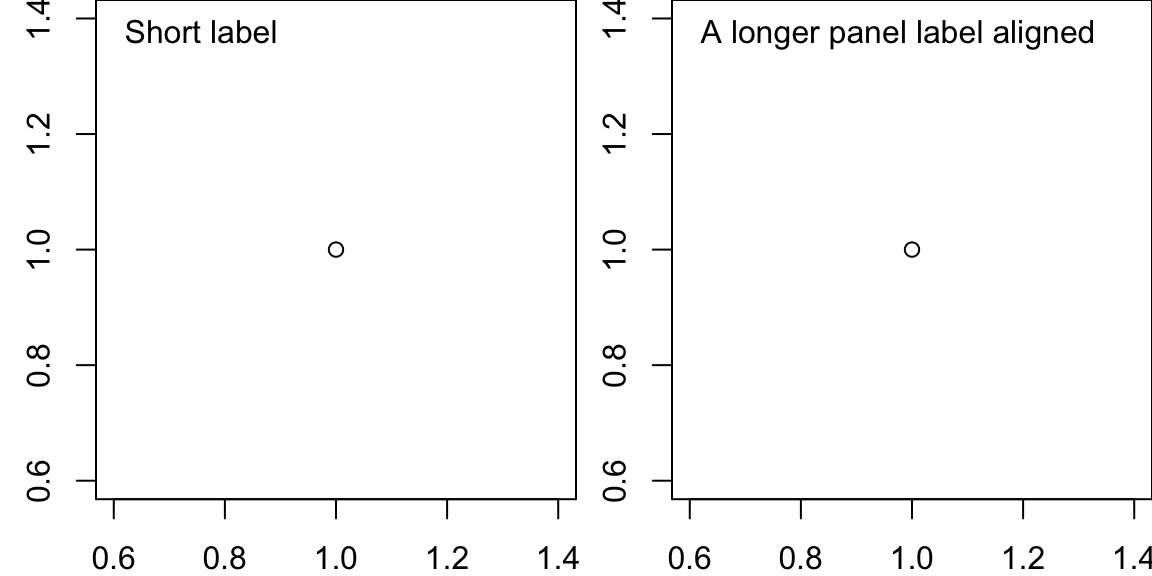
You can use text() combined with par("usr") to align these labels.
par("usr") gives us the coordinates of the plotting region in the order x1, x2, y1, y2. Therefore, we can do the following to place the labels 2% over
from the left and 7% down from the top:
labels <- c("Short label", "A longer panel label aligned")
par(mfrow = c(1, 2), mar = c(2, 2.5, 0, 0))
for(i in 1:2) {
  plot(1)
  u <- par("usr")
  x <- u[1] + 0.02 * (u[2] - u[1])
  y <- u[4] - 0.07 * (u[4] - u[3])
  text(x, y, labels[i], pos = 4)
}
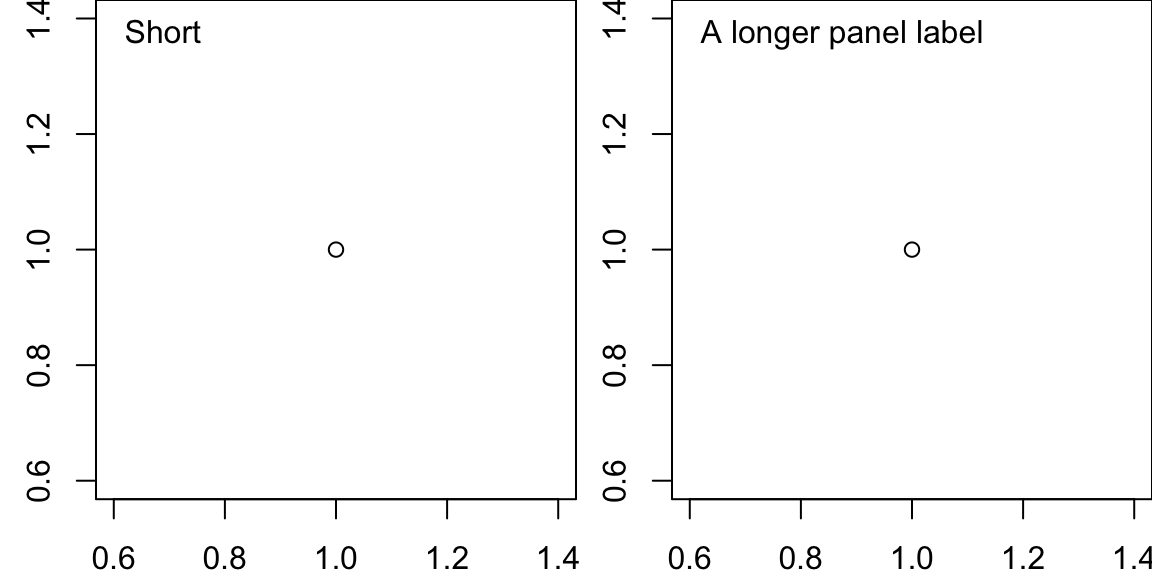
And we could turn that into a little function:
#' @param xfrac The fraction over from the left side.
#' @param yfrac The fraction down from the top.
#' @param label The text to label with.
#' @param pos Position to pass to text()
#' @param ... Anything extra to pass to text(), e.g. cex, col.
add_label <- function(xfrac, yfrac, label, pos = 4, ...) {
  u <- par("usr")
  x <- u[1] + xfrac * (u[2] - u[1])
  y <- u[4] - yfrac * (u[4] - u[3])
  text(x, y, label, pos = pos, ...)
}
And then use it like this:
labels <- c("Short", "A longer panel label")
par(mfrow = c(1, 2), mar = c(2, 2.5, 0, 0))
for(i in 1:2) {
  plot(1)
  add_label(0.02, 0.07, labels[i])
}