knitr::opts_chunk$set(cache = FALSE, autodep = TRUE)I’d heard whispers of this new R package TMB and finally spent some time playing with it in the last few days. It’s incredible — fast like ADMB (faster?), has built-in parallel functionality, has other advanced statistical niceties, and it’s built around R. What more could you ask for? (Well better documenation and the option to switch on Bayesian MCMC like you can in ADMB would be nice.) This post just represents some of my initial steps as I learned and played with the package.
The basic idea with TMB is to write a C++ template file and then compile and run it with some R functions. If you’ve used ADMB then the format will look similar. If you haven’t, it’s not too hard to pick up. It helps to know a bit about C++, but for the most part it shouldn’t be that hard for anyone familiar with R to pick it up.
The steps to running a TMB model are:
Write a C++ model template (a
.cppfile).Compile the model with
TMB::compile().Load the model object with
dyn.load(TMB::dynlib())Make an object with data and parameters to pass to the TMB model with
TMB::MakeADFun(). If there are random effects / latent variables / unobserved states / coefficients that are allowed to vary (choose your preferred terminology) then set therandomargument inTMB::MakeADFun()to specify the name(s) of the parameters to integrate out of the likelihood.Minimize the objective function with something like
stats::optim()orstats::nlminb().Extract the estimates and standard errors from the model fit with
TMB::sdreport()andTMB::summary.sdreport().
You can install the TMB package from GitHub. You’ll need a C++ compiler installed. If you’re on Windows then you’ll also need Rtools. See specific instructions on the TMB GitHub page.
# install.packages("devtools") # if needed
devtools::install_github("kaskr/adcomp", subdir = "TMB")
The documentation is still very sparse, but you can find some instructions on the R package GitHub wiki and documentation of the underlying C++ functions and classes here.
A linear regression example
Let’s start with a really simple linear regression model.
We’ll start by writing the TMB template file. Here, I’ve written it as inline R code that I then write() to a .cpp file. I have only done this so the code shows up here.
tmb_model <- "
// linear regression
#include <TMB.hpp>

template<class Type>
Type objective_function<Type>::operator() () {
// data:
DATA_VECTOR(x);
DATA_VECTOR(y);

// parameters:
PARAMETER(a); // intercept
PARAMETER(b); // slope
PARAMETER(log_sigma); // log(residual SD)
// we fit sigma on a log scale to keep it > 0

// procedures: (transformed parameters)
Type sigma = exp(log_sigma);

int n = y.size(); // get number of data points to loop over

Type nll = 0.0; // initialize negative log likelihood

for(int i = 0; i < n; i++){ // C++ starts loops at 0!
  // get negative log likelihood (last argument is log = TRUE)
  nll -= dnorm(y[i], a + b * x[i], sigma, true);
}

return nll;
}"
write(tmb_model, file = "regression.cpp")
We’ll load the model template:
library(TMB)
compile("regression.cpp")
dyn.load(dynlib("regression"))
And simulate some data:
set.seed(123)
x <- runif(20, 1, 10)
y <- rnorm(20, mean = 1.8 + 2.4 * x, sd = exp(0.3))
plot(x, y)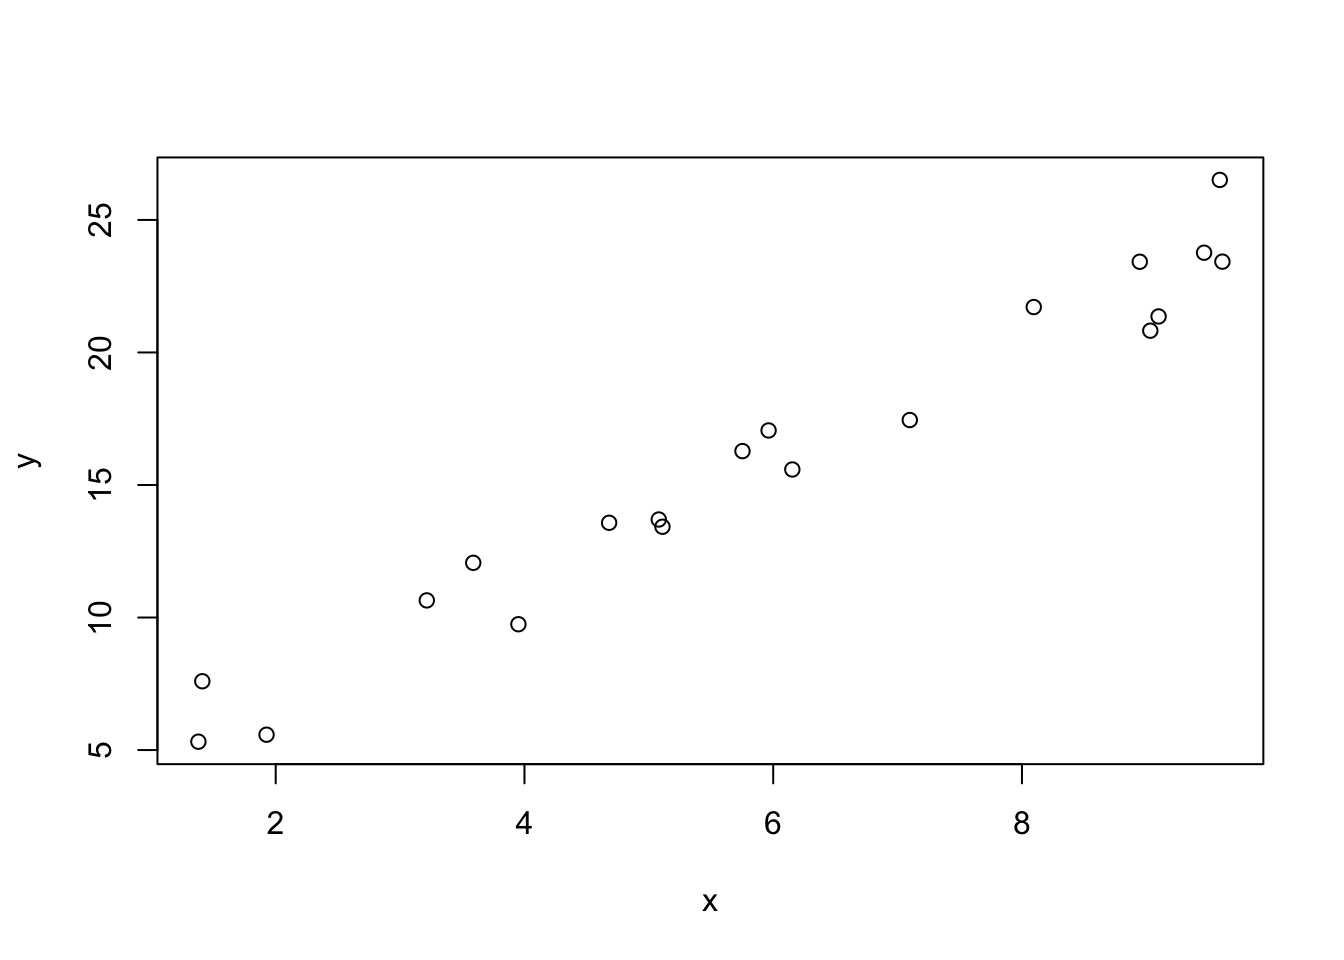
Then we’ll fit the model:
obj <- MakeADFun(
  data = list(x = x, y = y),
  parameters = list(a = 0, b = 0, log_sigma = 0),
  DLL = "regression")
opt <- nlminb(start = obj$par, obj = obj$fn, gr = obj$gr)
rep <- sdreport(obj)
We can check the estimates against the true values above (a = 1.8, b = 2.4, log_sigma = 0.3):
rep## sdreport(.) result
## Estimate Std. Error
## a 2.8291076 0.64964407
## b 2.2027874 0.09901161
## log_sigma 0.1968775 0.15811383
## Maximum gradient component: 3.910297e-05Which is about the same as we’d get from lm():
arm::display(lm(y ~ x))## lm(formula = y ~ x)
## coef.est coef.se
## (Intercept) 2.83 0.68
## x 2.20 0.10
## ---
## n = 20, k = 2
## residual sd = 1.28, R-Squared = 0.96Gompertz state space model
Now let’s try something a bit more exciting — a state space Gompertz population dynamics model. We’ll have TMB integrate out the unobserved “true” state that is masked by observation error. You can represent the Gompertz model as:
\[ \begin{aligned} y_t &= \ln N_t\\ U_t &= a + b U_{t-1} + \epsilon_t\\ \epsilon_t &\sim \mathrm{Normal}(0, \sigma^2_\mathrm{proc})\\\ y_t &\sim \mathrm{Normal}(U_t, \sigma^2_\mathrm{obs}), \end{aligned} \]
where \(y_t\) is the observed \(\ln\) abundance (\(N\)) at time \(t\). The model is density independent if \(b = 1\), maximally density dependent if \(b = 0\), and inversely density dependence if \(b < 0\). The parameter \(a\) represents the expected ln abundance at the next time step when \(y_t = 0\). The process noise is modelled as a normal distribution with mean of \(0\), and a standard deviation of \(\sigma_\mathrm{proc}\). \(U\) represents the unobserved state vector, and \(\sigma_\mathrm{obs}\) represents the standard deviation of observation error (on a log scale).
The TMB model for this state-space Gompertz model is:
tmb_model <- "
// State-space Gompertz model
#include <TMB.hpp>

template<class Type>
Type objective_function<Type>::operator() () {
// data:
DATA_VECTOR(y);

// parameters:
PARAMETER(a); // population growth rate parameter
PARAMETER(b); // density dependence parameter
PARAMETER(log_sigma_proc); // log(process SD)
PARAMETER(log_sigma_obs); // log(observation SD)
PARAMETER_VECTOR(u); // unobserved state vector

// procedures: (transformed parameters)
Type sigma_proc = exp(log_sigma_proc);
Type sigma_obs = exp(log_sigma_obs);

// reports on transformed parameters:
ADREPORT(sigma_proc)
ADREPORT(sigma_obs)

int n = y.size(); // get time series length

Type nll = 0.0; // initialize negative log likelihood

// process model:
for(int i = 1; i < n; i++){
  Type m = a + b * u[i - 1]; // Gompertz
  nll -= dnorm(u[i], m, sigma_proc, true);
}

// observation model:
for(int i = 0; i < n; i++){
  nll -= dnorm(y[i], u[i], sigma_obs, true);
}

return nll;
}"
write(tmb_model, file = "gompertztmb.cpp")
We’ll compile the model:
compile("gompertztmb.cpp")
dyn.load(dynlib("gompertztmb"))
And write a function that simulates some data, fits the model, and plots the estimates:
sim_gomp <- function(N = 100, seed = 123, sigma_obs = 0.2,
sigma_proc = 0.2, a = 1.4, b = 0.7, y1 = 4) {
set.seed(seed)
N <- N
ytrue <- numeric(length = N)
ytrue[1] <- y1
log_sigma_proc <- log(sigma_proc)
proc_error <- rnorm(N, mean = 0, sd = sigma_proc)
log_sigma_obs <- log(sigma_obs)
for(i in 2:N) {
ytrue[i] <- a + b * ytrue[i-1] + proc_error[i-1]
}
x <- seq_len(N)
y <- rnorm(N, mean = ytrue, sd = sigma_obs)
data <- list(y = y)
parameters <- list(a = 1, b = 0.5, log_sigma_proc = -1,
log_sigma_obs = -1, u = rep(mean(y), N))
obj <- MakeADFun(data, parameters, random = "u", DLL = "gompertztmb")
obj$hessian <- FALSE
opt <- nlminb(start = obj$par, obj = obj$fn, gr = obj$gr)
rep <- sdreport(obj)
# extract estimated process:
u <- summary(rep, "random")[, "Estimate"]
u_se <- summary(rep, "random")[, "Std. Error"]
# extract fixed effects:
fixed <- summary(rep, "fixed")
# We'll write a little helper function to plot fixed effect
# estimates:
plot_fixed <- function(par, y, mat, trans = I) {
points(trans(eval(parse(text = par))), y, pch = 21,
bg = "#00000030", col = "#00000080")
f <- mat[par, "Estimate"]
se <- mat[par, "Std. Error"]
points(trans(f), y, pch = 19, col = "red")
segments(trans(f - 2 * se), y, trans(f + 2 * se), y, pch = 19,
col = "red")
}
par(mfrow = c(2, 1), mar = c(4, 6, 0, 0), oma = c(.5, .5, .5, .5),
mgp = c(2, 0.5, 0), cex = 1, tck = -0.02)
plot(1, 1, xlim = c(0, 2), ylim = c(1, 4), type = "n",
xlab = "Coefficient value", ylab = "", yaxt = "n")
axis(2, at = 1:4, labels = c("a", "b", "sigma_obs", "sigma_proc"),
las = 1)
plot_fixed("a", 1, fixed)
plot_fixed("b", 2, fixed)
plot_fixed("log_sigma_obs", 3, fixed, trans = function(z) exp(z))
plot_fixed("log_sigma_proc", 4, fixed, trans = function(z) exp(z))
plot(x, y, col = "#00000080", pch = 21, bg = "#00000030", las = 1,
ylab = "log(abundance)", xlab = "time")
lines(x, ytrue, lty = 2, lwd = 2)
lines(x, u, col = "red", lty = 1, lwd = 1.5)
polygon(c(x, rev(x)), c(u - 2 * u_se, rev(u + 2 * u_se)),
border = NA, col = "#FF000050")
legend("bottomright", legend = c("Observed", "True", "Estimated"),
pch = c(21, NA, NA), lty = c(NA, 2, 1), lwd = c(NA, 2, 1.5),
col = c("#00000080", "black", "red"),
pt.bg = c("#00000030", NA, NA))
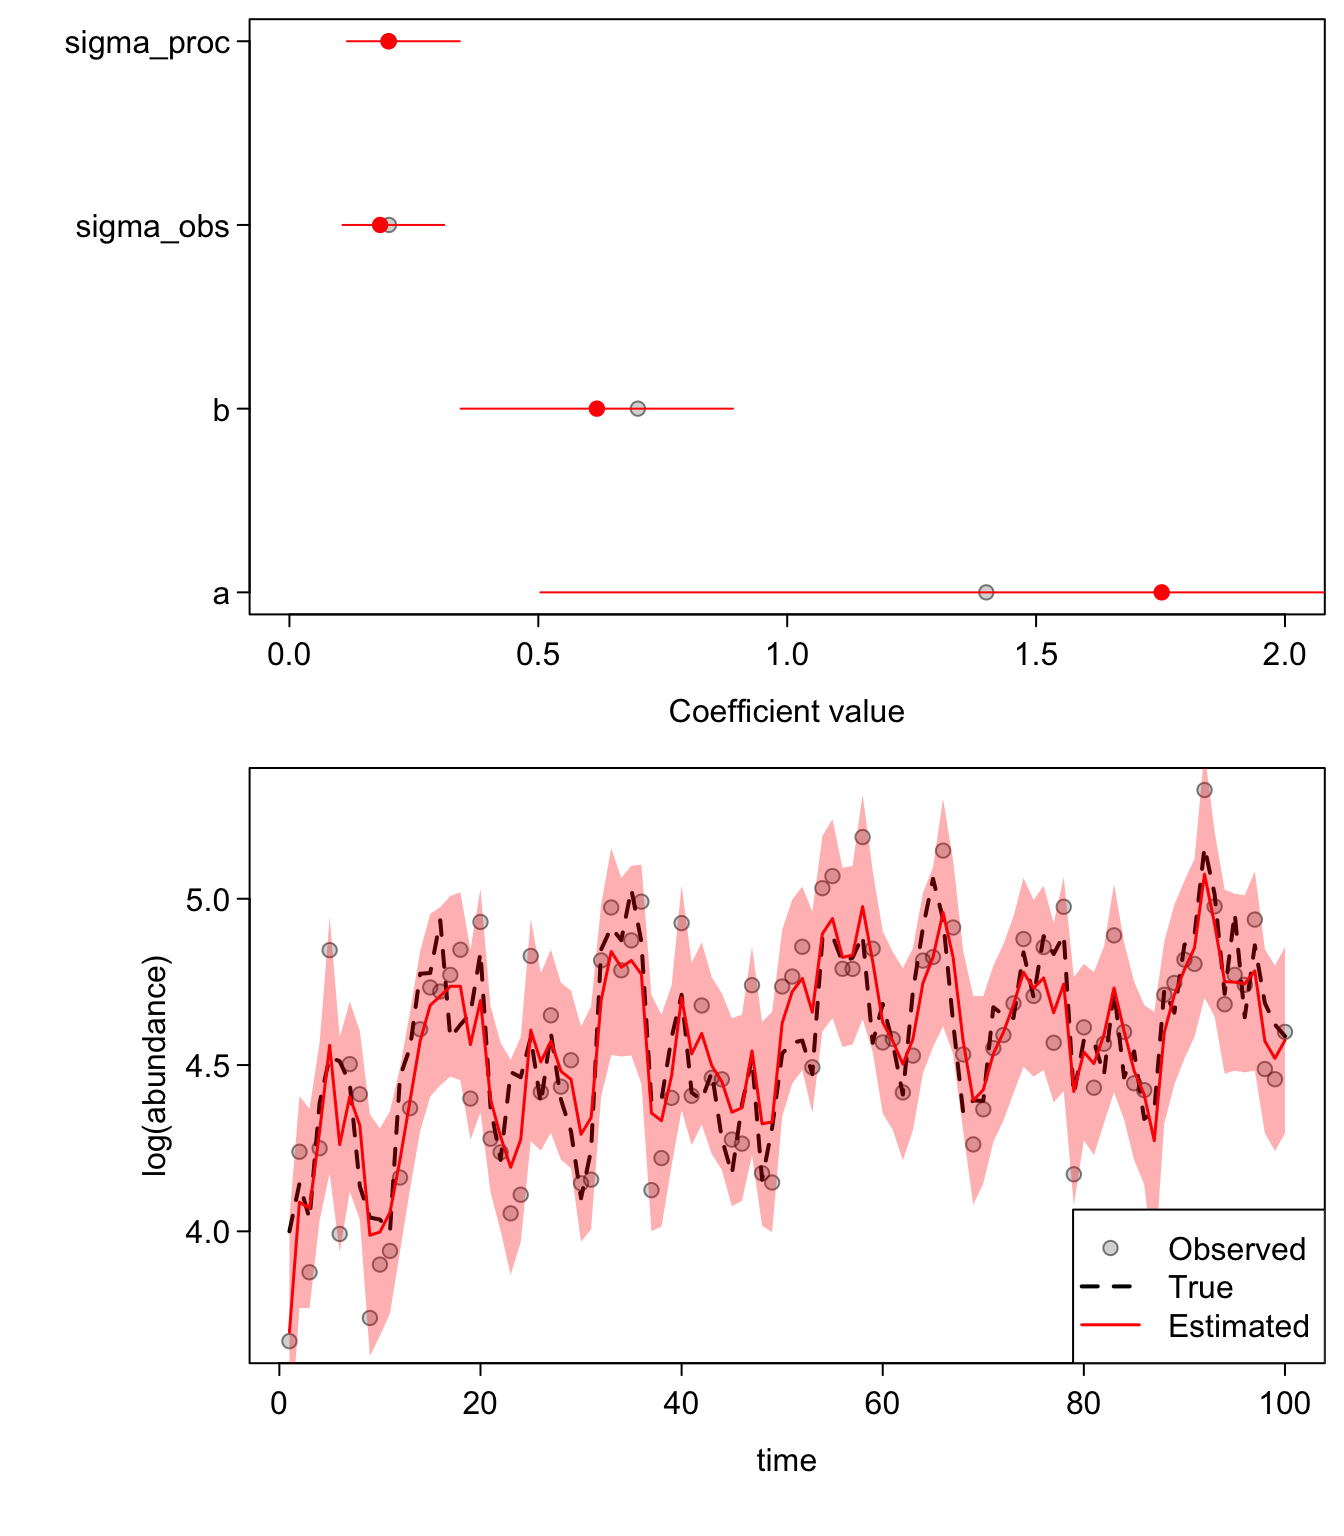
}One good test that you’ve coded a model correctly is to throw a boat-load of data at it and make sure it comes back with unbiased parameter estimates. In the following plots, the first panel shows the coefficient estimates (“fixed effects”) +/- two standard errors. The red dots are our estimates and the shaded grey dots are the true values. In the lower panels, the red lines are our estimated states, the black line (hidden behind the red in the first plot) is the true underlying state, and the grey dots are our observations.
sim_gomp(N = 5000, sigma_obs = 0.1, sigma_proc = 0.2, b = 0.7, a = 1.4)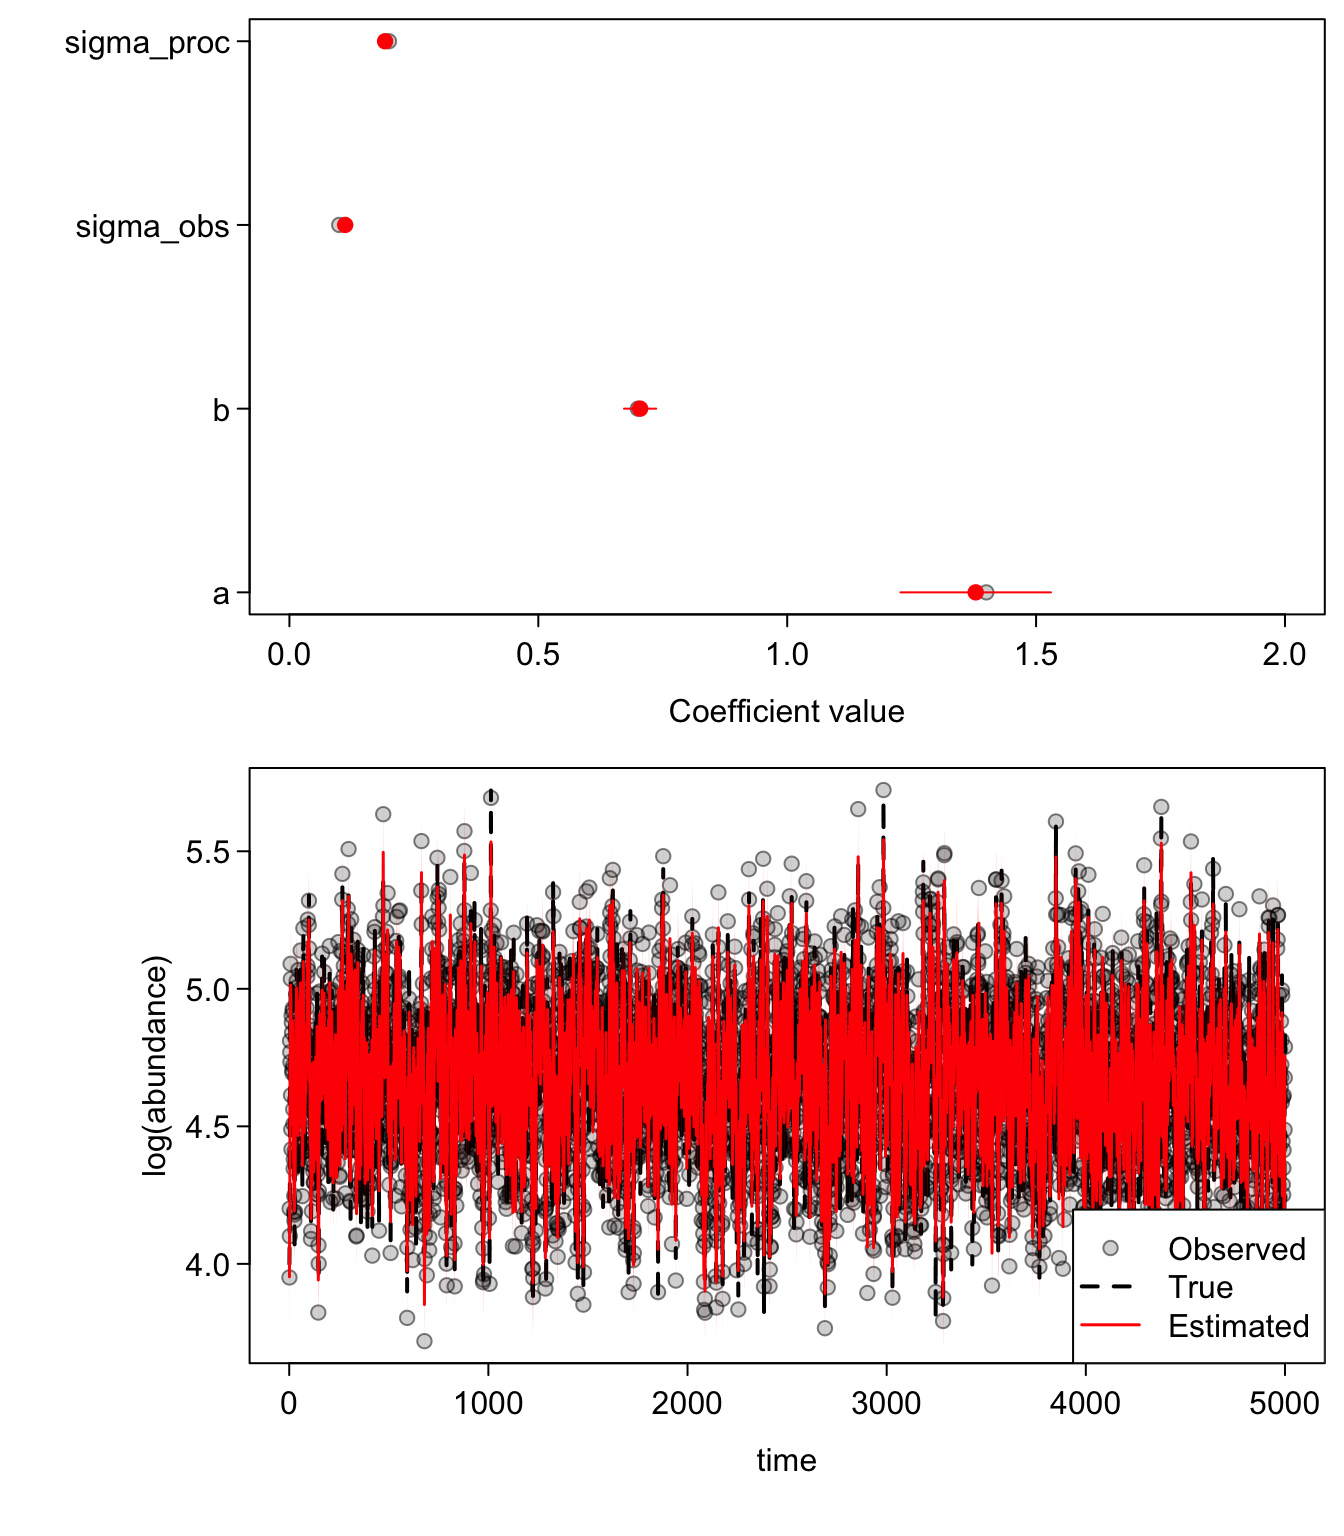
We just modelled a 5000 time step state space model in a couple seconds!
Now we can try a more realistic 50 data points:
sim_gomp(N = 50)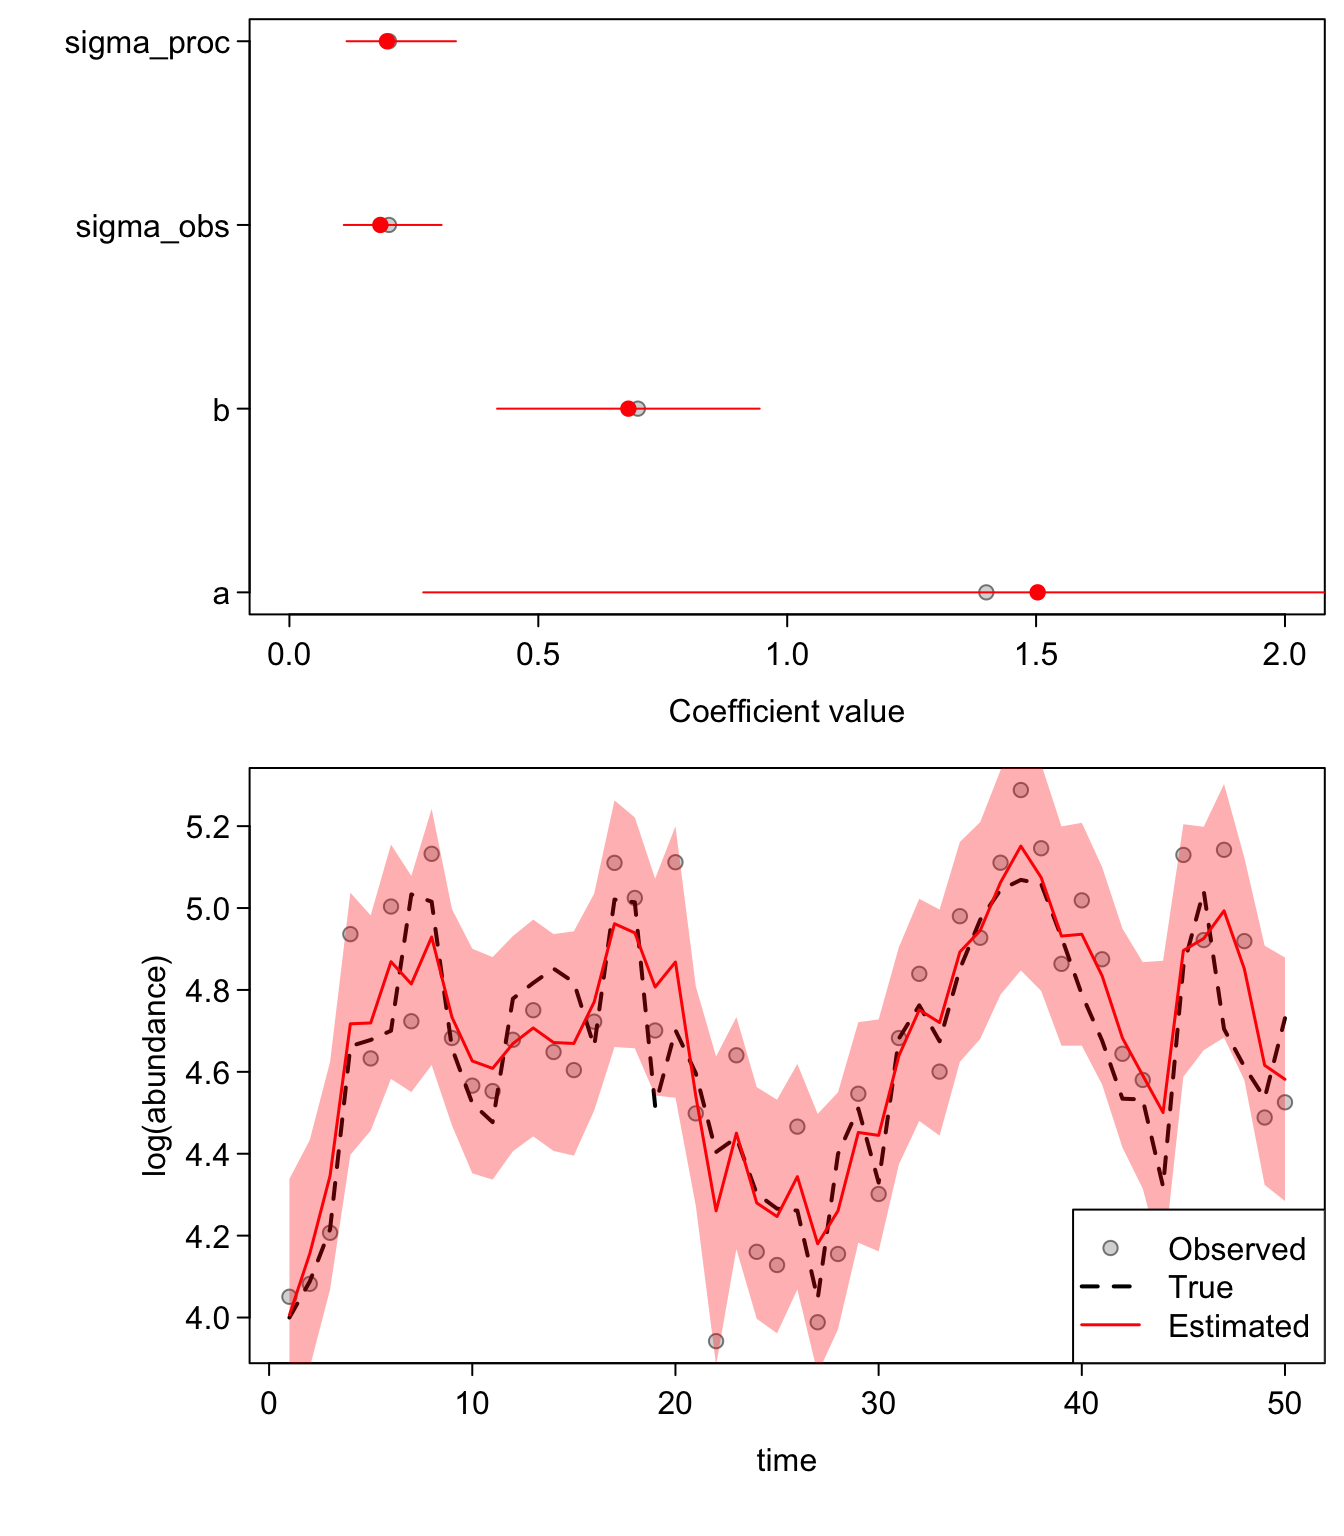
And with a different seed value but more data:
sim_gomp(N = 100, seed = 999)